

Scientists are turning data into sound to listen to the whispers of the universe (and more)
- Written by: Jeffrey Cooke, Professor, Centre for Astrophysics and Supercomputing, Swinburne University of Technology
We often think of astronomy as a visual science with beautiful images of the universe. However, astronomers use a wide range of analysis tools beyond images to understand nature at a deeper level.
Data sonification is the process of converting data into sound. It has powerful applications in research, education and outreach, and also enables blind and visually impaired communities to understand plots, images and other data.
Its use as a tool in science is still in its early stages – but astronomy groups are leading the way.
In a paper[1] published in Nature Astronomy, my colleagues and I discuss the current state of data sonification in astronomy and other fields, provide an overview of 100 sound-based projects[2] and explore its future directions.
The cocktail party effect
Imagine this scene: you’re at a crowded party that’s quite noisy. You don’t know anyone and they’re all speaking a language you can’t understand – not good. Then you hear bits of a conversation in a far corner in your language. You focus on it and head over to introduce yourself.
While you may have never experienced such a party, the thought of hearing a recognisable voice or language in a noisy room is familiar. The ability of the human ear and brain to filter out undesired sounds and retrieve desired sounds is called the “cocktail party effect[3]”.
Similarly, science is always pushing the boundaries of what can be detected, which often requires extracting very faint signals from noisy data. In astronomy we often push to find the faintest, farthest or most fleeting of signals. Data sonification helps us to push these boundaries further.
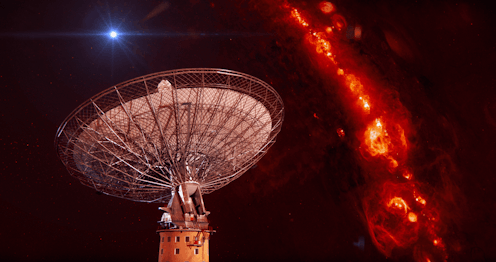
The video below provides examples of how sonification can help researchers discern faint signals in data. It features the sonification of nine bursts from a repeating fast radio burst called FRB121102.
Casey Law/Youtube.Fast radio bursts are millisecond bursts of radio emission that can be detected halfway across the universe. We don’t yet know what causes them. Detecting them in other wavelengths is the key to understanding their nature.
Read more: A brief history: what we know so far about fast radio bursts across the universe[4]
Too much of a good thing
When we explore the universe with telescopes, we find it’s full of cataclysmic explosions including the supernova deaths of stars, mergers of black holes and neutron stars that create gravitational waves, and fast radio bursts.
Here you can listen to the merger of two black holes.
LIGO/YouTube.And the merger of two neutron stars.
LIGO/YouTube.These events allow us to understand extreme physics at the highest-known energies and densities. They help us to measure the expansion rate of the universe and how much matter it contains, and to determine where and how the elements were created, among other things.
Upcoming facilities such as the Rubin Observatory and the Square Kilometre Array will detect tens of millions of these events each night. We employ computers and artificial intelligence to deal with these massive numbers of detections.
However, the majority of these events are faint bursts, and computers are only so good at finding them. A computer can pick out a faint burst if it’s given a template of the “desired” signal. But if signals depart from this expected behaviour, they become lost.
And it’s often these very events that are the most interesting and yield the biggest insight into the nature of the universe. Using data sonification to verify these signals and identify outliers can be powerful.
More than meets the eye
Data sonification is useful for interpreting science because humans interpret audio information faster than visual information. Also, the ear can discern more pitch levels than the eye can discern levels of colour (and over a wider range).
Another direction we’re exploring for data sonification is multi-dimensional data analysis – which involves understanding the relationships between many different features or properties in sound.
Plotting data in ten or more dimensions simultaneously is too complex, and interpreting it is too confusing. However, the same data can be comprehended much more easily through sonification.
As it turns out, the human ear can tell the difference between the sound of a trumpet and flute immediately, even if they play the same note (frequency) at the same loudness and duration.
Why? Because each sound includes higher-order harmonics that help determine the sound quality, or timbre. The different strengths of the higher-order harmonics enable the listener to quickly identify the instrument.
Now imagine placing information – different properties of data – as different strengths of higher-order harmonics. Each object studied would have a unique tone, or belong to a class of tones, depending on its overall properties.
With a bit of training, a person could almost instantly hear and recognise[5] all of the object’s properties, or its classification, from a single tone.
Beyond research
Sonification also has great uses in education (Sonokids[6]) and outreach (for example, SYSTEM Sounds[7] and STRAUSS[8]), and has widespread applications in areas including medicine, finance and more.
But perhaps its greatest power is to enable blind and visually impaired communities to understand images and plots to help with everyday life.
It can also enable meaningful scientific research, and do so quantitatively, as sonification research tools[9] provide numerical values on command.
This capability can help promote STEM careers among blind and visually impaired people. And in doing so, we can tap into a massive pool of brilliant scientists and critical thinkers who may otherwise not have envisioned a path towards science.
What we need now is government and industry support in developing sonification tools further, to improve access and usability, and to help establish sonification standards.
With the growing number of tools available, and the growing need in research and the community, the future of data sonification sounds bright!
Read more: Digital inequality: why can I enter your building – but your website shows me the door?[10]
References
- ^ paper (arxiv.org)
- ^ projects (sonification.design)
- ^ cocktail party effect (www.audiology.org)
- ^ A brief history: what we know so far about fast radio bursts across the universe (theconversation.com)
- ^ hear and recognise (www.cambridge.org)
- ^ Sonokids (www.sonokids.org)
- ^ SYSTEM Sounds (www.system-sounds.com)
- ^ STRAUSS (www.audiouniverse.org)
- ^ sonification research tools (www.jeffreyhannam.com)
- ^ Digital inequality: why can I enter your building – but your website shows me the door? (theconversation.com)
&media=https://www.thetimes.com.au/https://images.theconversation.com/files/479315/original/file-20220816-22-o373py.png?ixlib=rb-1.1.0&rect=14%2C2%2C1902%2C1003&q=45&auto=format&w=496&fit=clip&description=Scientists%20are%20turning%20data%20into%20sound%20to%20listen%20to%20the%20whispers%20of%20the%20universe%20(and%20more) "Pin It")