
Six graphs that explain Australia's recession
- Written by: Peter Martin, Visiting Fellow, Crawford School of Public Policy, Australian National University
Australia’s recession is the deepest since the Great Depression of the early 1930s.
Nothing else comes close.
The economy shrank an extraordinary 7% in the three months to June – by far the biggest collapse[1] since the Bureau of Statistics began compiling records in 1959.
The previous worst quarterly outcome was minus 2%, in June 1974.
Quarterly percentage change in gross domestic product
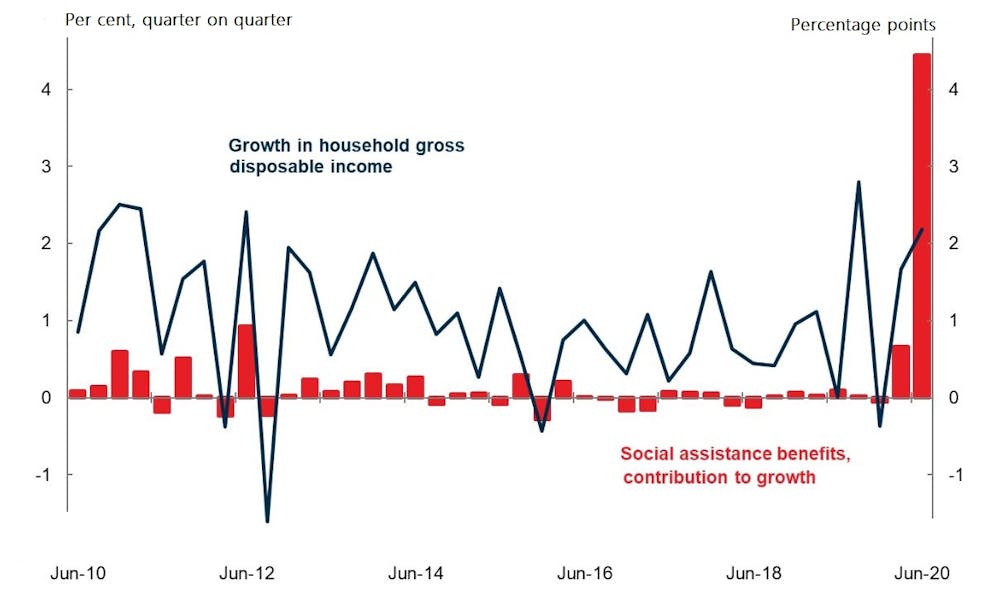
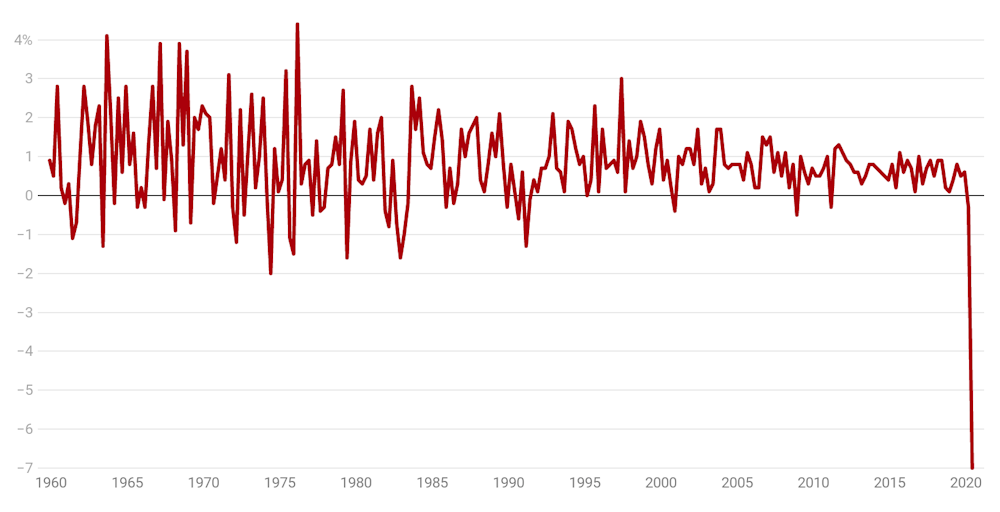 ABS National Accounts[2] It was going to be worse. Treasurer Josh Frydenberg told a parliament house press conference that in March his advisers were predicting a collapse three times as big in the June quarter – 20%. In May the forecast was for a June quarter collapse of 10%. Britain’s economy actually did collapse 20% in the June quarter; the US economy collapsed by nearly 10%. What staved off a collapse of the order feared was unprecedented government support – more than A$100 billion in JobKeeper and expanded JobSeeker payments alone–enough to actually lift household incomes while 643,000 Australians lost their jobs and many more lost hours. Contribution of government benefits to household income growth
  Commonwealth Treasury A better measure of living standards, taking account households and businesses, so-called “real net national disposable income per capita”, fell nonetheless, by a record 8%. Quarterly percentage change in living standards
 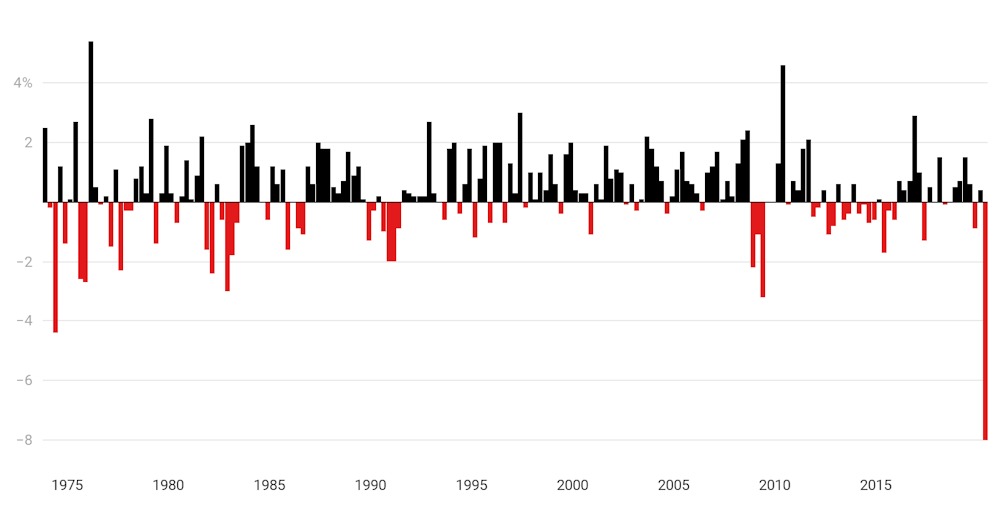 Quarterly change in real national disposable income per capita. ABS Australian National Accounts[3] Consumer spending fell by even more, an extraordinary 12.7%, in part because lockdowns and caution in the face of COVID-19 provided fewer opportunities to spend. Given that consumer spending climbed not at all over the three quarters leading up to the June quarter, it meant that household spending fell over the entire financial year, for the first time since records have been kept. Quarterly change in household final consumption expenditure
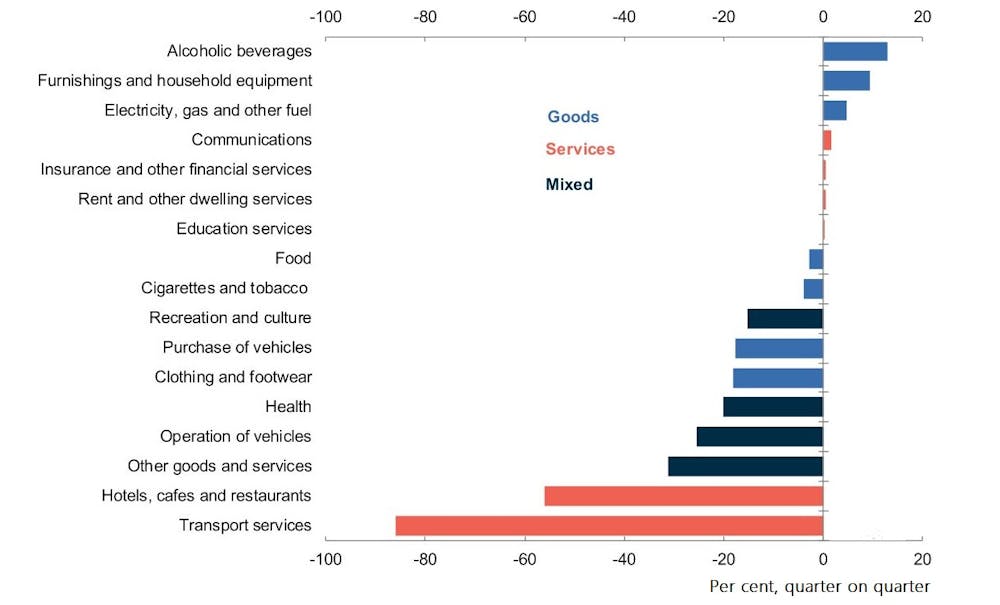
 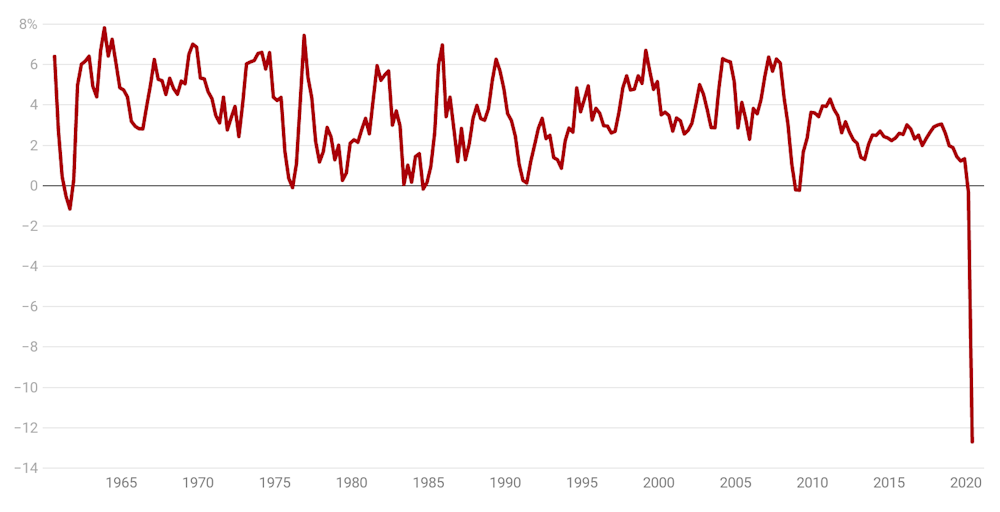 ABS Australian National Accounts[4] Spending on goods was barely hit, while spending on services collapsed 17.6%. Spending on transport services, a category that encompasses everything from flights to public transport, fell 88%. Spending on accommodation, a category that encompasses tourism, fell 55.7%. Spending on recreational and cultural services, a category that encompasses sporting events, gambling and performances and cinema admissions, fell 54.5%. Household spending by category
  Commonwealth Treasury It meant far more income than usual was saved. During the depths of the global financial crisis, Australia’s household saving ratio climbed to a peak of 10.9% as households squirrelled away one in every ten dollars they earned. In June they squirrelled away a remarkable 19.7% – one in five dollars that came in the door. Household saving ratio
 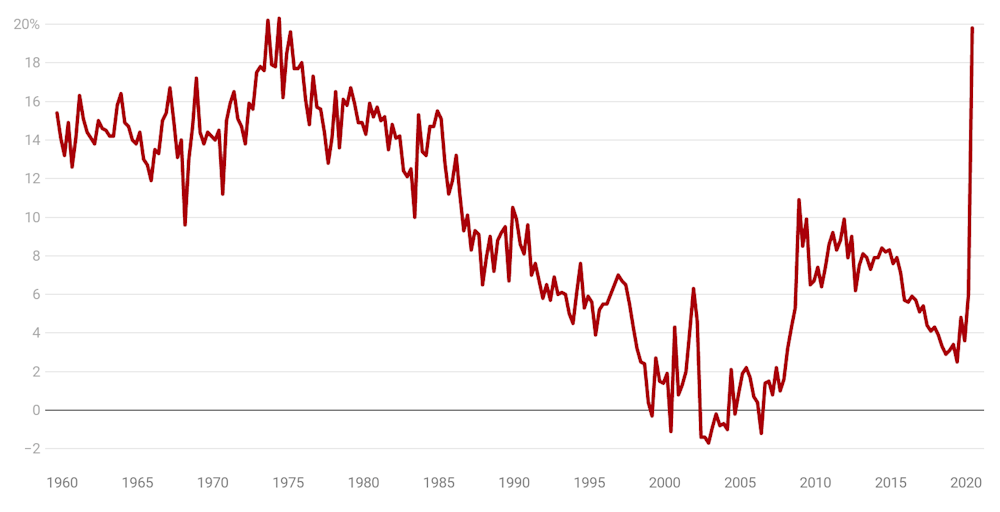 ABS Australian National Accounts The Bureau of Statistics says if household income from special initiatives including early access to super was included, the household income ratio would be even higher. What it calls the “household experience savings ratio” would be 24.8%. It’s possible to see households saving one in every four dollars as a “glass half full”. Frydenberg does. He says this never-before-experienced accumulation of savings will be useful in the recovery, giving people the capacity to spend big when restrictions ease and they are better able to spend. What if we remain unwilling to spend… That’s assuming people aren’t “scarred” by the experience, left with damaged psyches and unwilling spend, a possibility the Treasurer acknowledges. He says for the next quarter, the current one that encompasses the three months to the end of September, the Treasury is expecting economic activity to shrink only a little further or no further at all. A lot depends on how soon Victoria’s Stage 4 restrictions and other restrictions are eased, which means a lot depends on things that are unknowable. …and businesses unwilling to invest? The Treasurer will deliver the budget in a little over four weeks’ time[5]. He said a key part of it will be measures to make it easier for businesses to do business, unlocking “entrepreneurship and innovation” at low cost. Businesses certainly could invest more. Non-mining business investment was down 9.3% in the quarter. On Tuesday the Reserve Bank made available an extra $57 billion at low cost for banks to advance businesses and households. But they are only likely to want to invest more when they can see returns. Read more: Australia won't recover unless Victoria does too. The federal government must step up[6] Examining the figures on Wednesday, former Reserve Bank economist Callam Pickering said they showed the economy being held together “with duct tape by JobKeeper and JobSeeker”. At his press conference, Frydenberg resisted suggestions that he revisit the wind-downs of JobKeeper and the JobSeeker Coronavirus Supplement due to take place over the next six months. But the Victorian situation is far worse than when he announced the schedule on July 21[7]. He might find there’s a case for more duct tape, for a while longer.
 References
- ^ biggest collapse (www.abs.gov.au)
- ^ ABS National Accounts (www.abs.gov.au)
- ^ ABS Australian National Accounts (www.abs.gov.au)
- ^ ABS Australian National Accounts (www.abs.gov.au)
- ^ four weeks’ time (ministers.treasury.gov.au)
- ^ Australia won't recover unless Victoria does too. The federal government must step up (theconversation.com)
- ^ July 21 (www.australia.gov.au)
Authors: Peter Martin, Visiting Fellow, Crawford School of Public Policy, Australian National University
Read more https://theconversation.com/six-graphs-that-explain-australias-recession-145445