Octa broker on graphical analysis: identifying potentially profitable trades with candlestick charts
KUALA LUMPUR, MALAYSIA - Media OutReach Newswire - 18 April 2025 - Trading success often depends on whether or not one can pinpoint potentially profitable assets before sharp price movement. This is particularly evident in crypto, where high volatility is the norm.
Technical analysis—an analysis of historical price action and chart patterns—is one of the main methods to predict price direction. Candlestick analysis, a part of technical analysis, allows traders to visualise potential price movements. Octa, a broker with globally recognised licences, shares how candlestick analysis can be used to identify specific patterns that might suggest future price changes. 
Understanding candlestick charts
Candlestick charts help traders respond quickly to market shifts by providing clear visual signals. Unlike line charts, candlesticks offer more details within a specific time frame, which is essential in the fast-paced crypto market.Common bullish patterns include:
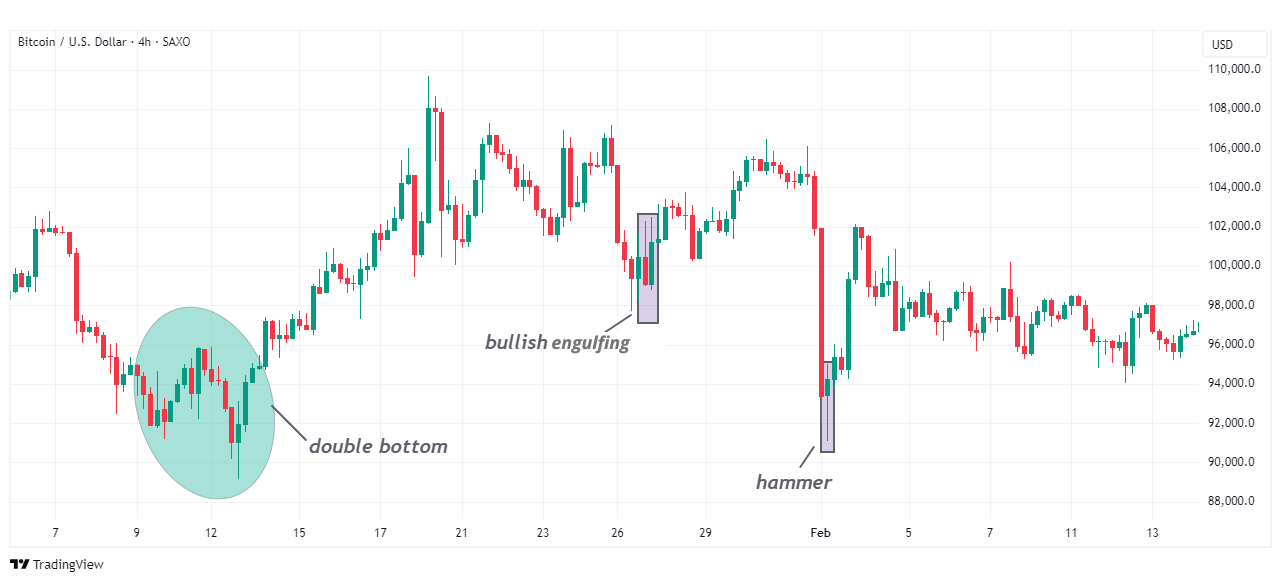
- Hammer. A candle with a small body and long lower wick. It may signal a reversal to the upside when it appears after a downtrend.
- Bullish Engulfing. A two-candle pattern where the second bullish (green) candle fully engulfs the first bearish (red) candle. It often indicates potential upward movement when found at the bottom of a bearish trend.
- Double Bottom. A formation with two similar lows, suggests a reversal and possible price increase.
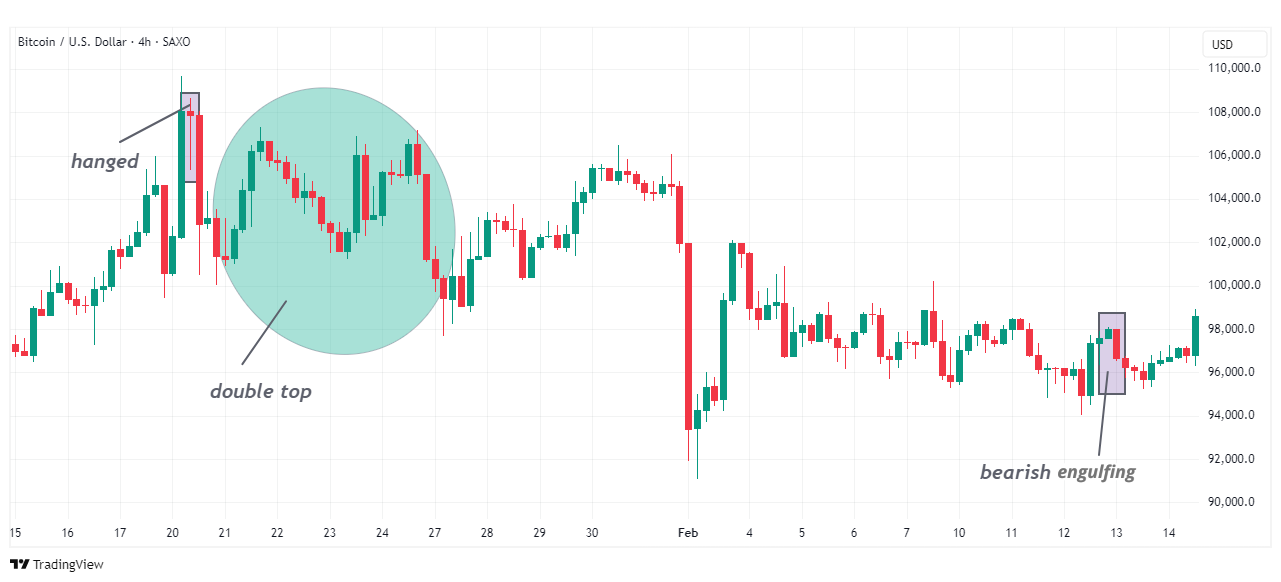
- Hanging Man. A small-bodied candle with a long lower wick, appearing at the top of an uptrend, often suggests a downturn.
- Bearish Engulfing. A two-candle pattern where the second bearish (red) candle completely engulfs the first bullish (green) candle.
- Double Top. A structure with two similar highs often warns of a reversal to the downside.
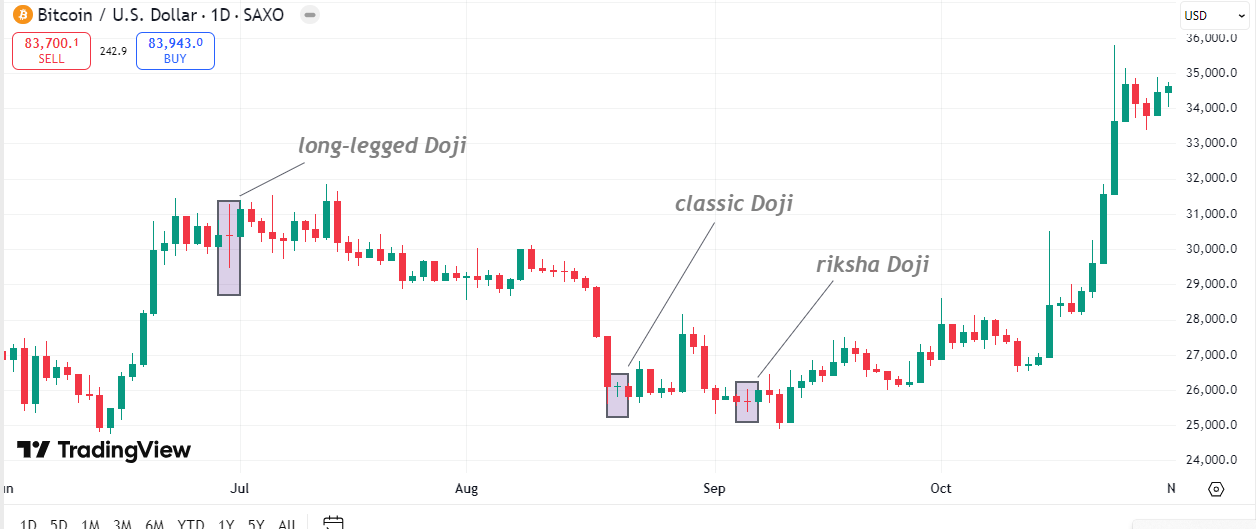
Besides bullish and bearish patterns, there are so-called neutral candlestick chart patterns like doji. They often signify indecision in the market when the relative strength of buyers and sellers is roughly balanced. Here are some typical doji candlesticks:
- Classic Doji. The opening and closing prices of the candle almost coincide. The candle resembles a thin horizontal line with short shadows at the top and bottom. If the closing price is higher than the opening one, a bullish doji may appear, indicating a potential asset price increase.
- Long-legged Doji. A pattern with long shadows up and (or) down. It signals major indecision, with more potential for a bearish market.
- Riksha Doji. This pattern has a similar shadow length, and the price is in the middle of the trading range.
Key elements of graphical analysis
To forecast price direction and spot valuable trades, traders should also use other tools of graphical analysis. Here are the main ones to consider when analysing candlestick patterns.Support and resistance levels
- Support: a level where prices tend to stop falling and start rising due to increased buying interest.
- Resistance: a level where prices often stall or reverse due to selling pressure
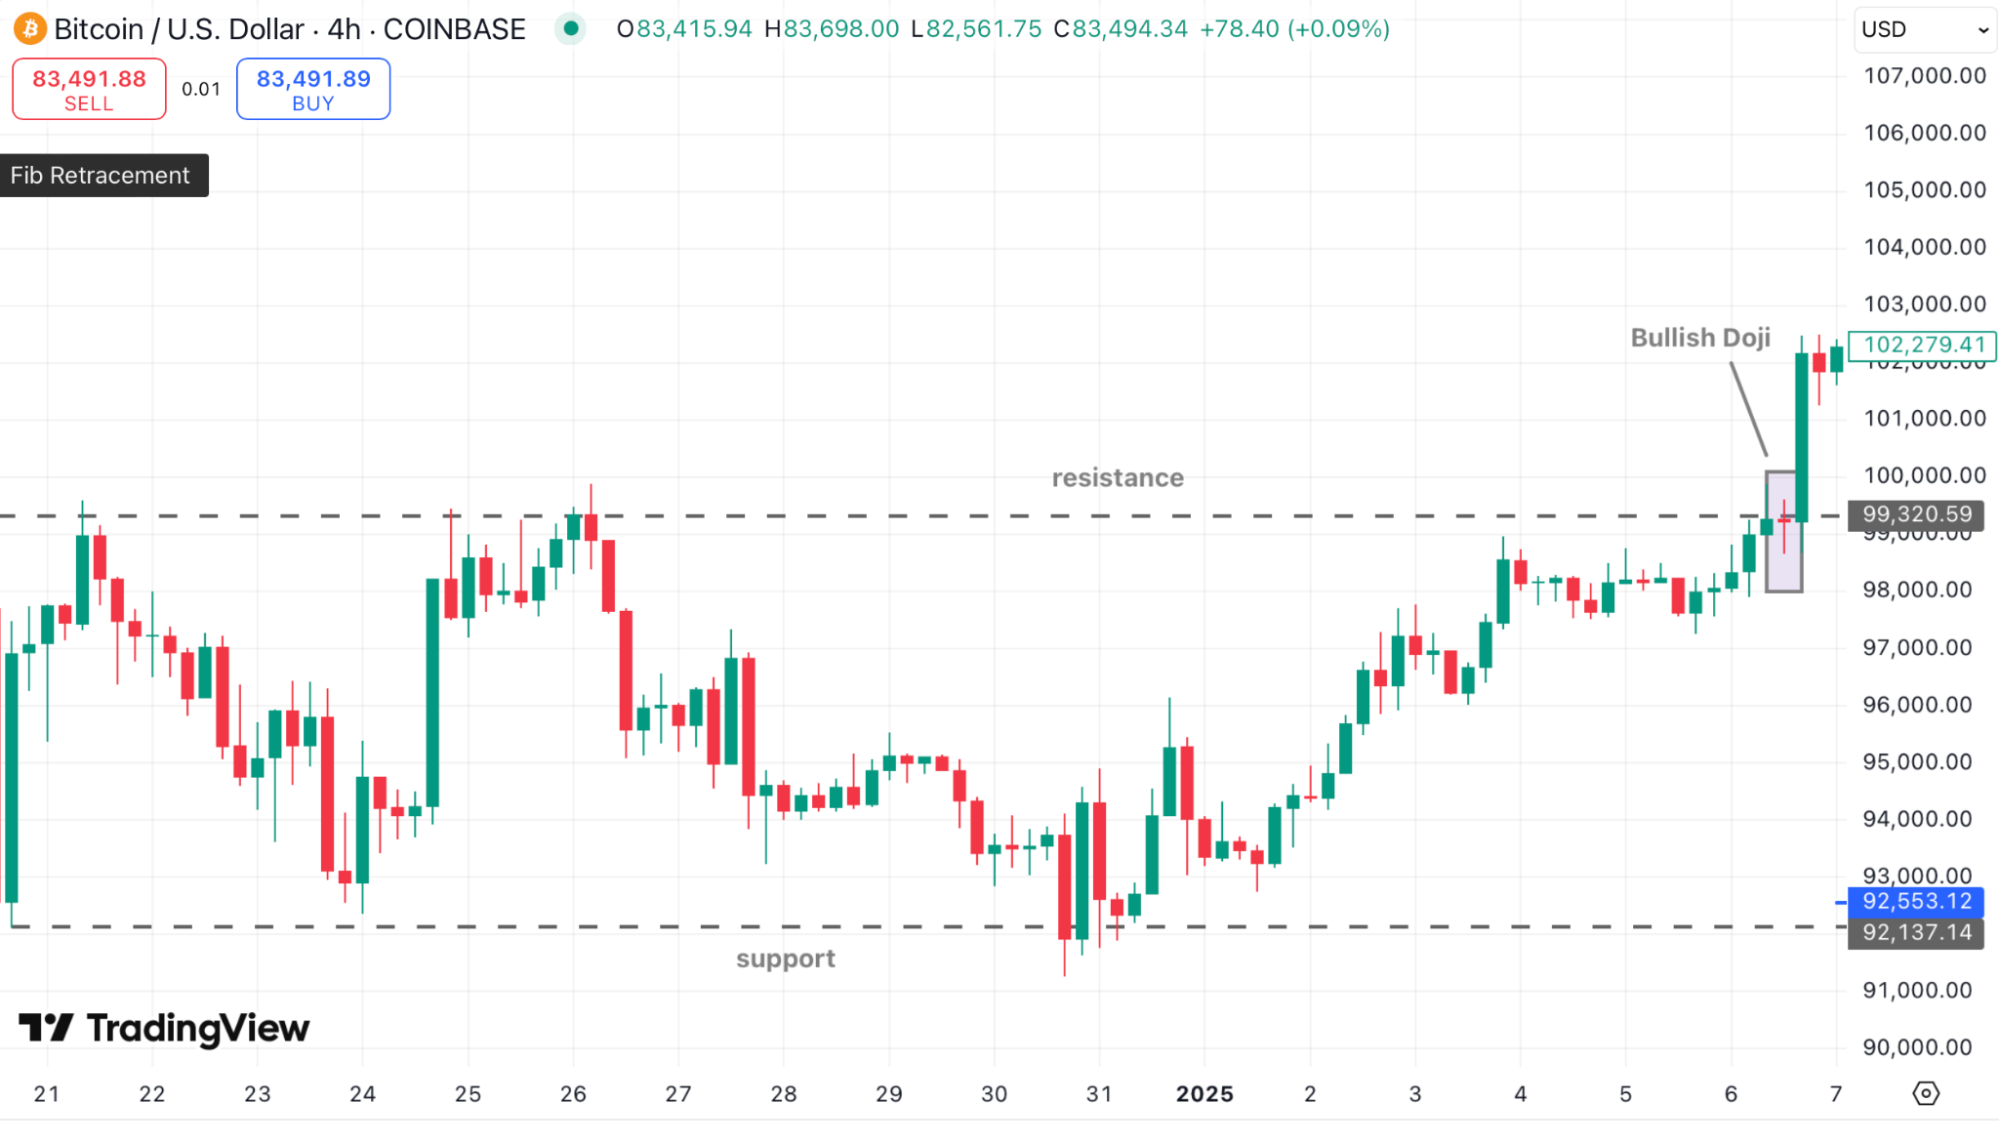
Traders often look to trade on bounces from these levels or breakouts beyond them. For example, on a historical 4H BTC/USD chart, the price approached the $99,320 resistance level, formed a bullish doji mentioned above, and then decisively broke upward.
Trend
- Uptrend: drawn through higher lows, indicating support in a rising market.
- Downtrend: drawn through lower highs, indicating resistance in a falling market.
A guide to reading candlestick chart patterns
Candlestick charts offer valuable insight into market sentiment but correctly interpreting them is essential. Here are several practical tips for traders: Read patterns in context. In uptrends, look for bearish reversal signals (e.g. bearish engulfing). In downtrends, seek bullish signals (e.g. hammer, bullish engulfing). In sideways markets, dojis and long-wick candles suggest uncertainty—it's often best to wait for a clear signal.
Focus on key levels. Patterns forming near major support or resistance levels (local highs/lows or historical pivots) are more likely to play out successfully.
Analyse candle size and shape. Large candles with solid bodies suggest strong momentum. Small-bodied candles with long wicks (doji) indicate indecision and uncertainty. Weakening impulse and smaller candles often precede reversal patterns like hammers or engulfing formations.
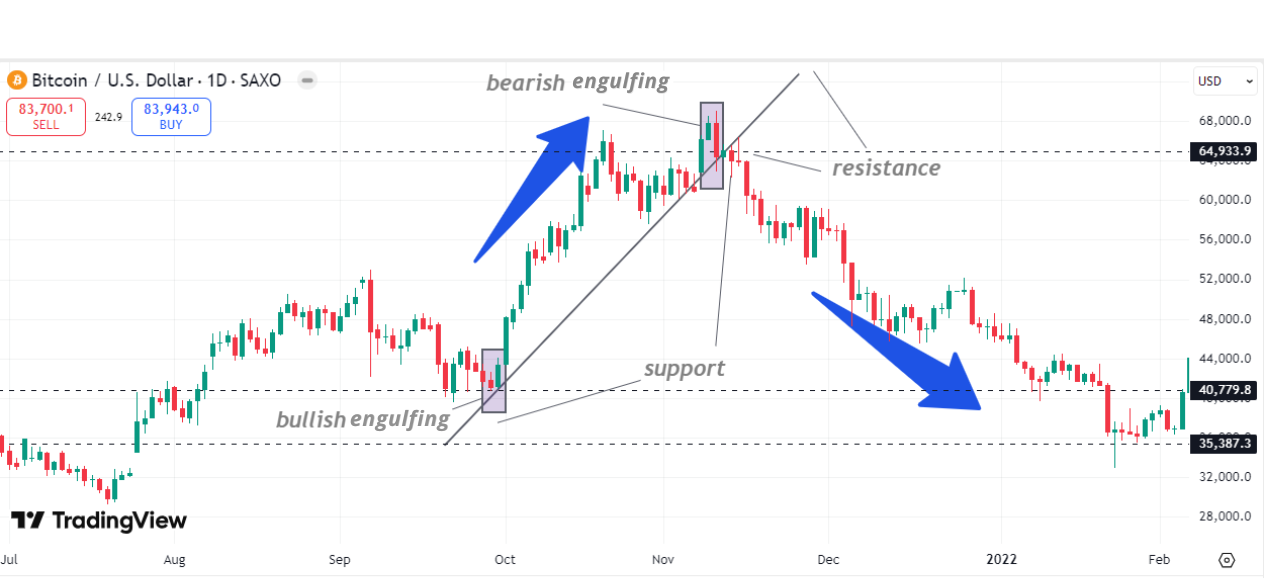
Backtest with historical data. Studying historical price action helps reinforce your understanding of patterns. For instance, the 1D BTC/USD chart shows that the trend turned upward after the Bullish Engulfing pattern was formed at the support of $40,779. Then, the price approached the resistance at $64,933 and after forming a Bearish Engulfing candle stick pattern, the asset failed to continue the uptrend, and its price sharply declined towards the $40,779 support and then down to $35,387.
‘Relying on single candlestick patterns is risky, as they fail to showcase the full picture—yet when analysed in context, they can pinpoint early signals of potentially promising assets. 'Trading decisions should always be confirmed with additional technical indicators. Combining candlestick analysis with technical tools can increase the accuracy of your forecasts' — says Kar Yong Ang, financial market analyst at Octa broker.
Graphical analysis helps traders identify promising assets by interpreting visual price patterns. However, no approach guarantees accuracy. To minimise risk, use a holistic strategy: study candlestick formations alongside key levels and trends, combine them with indicators and volume data and always consider the fundamental context. Macro events, trading volume, liquidity, market sentiment—all of these factors shape the price trajectory of a cryptocurrency. The more data you evaluate, the higher the chances of making a well-informed decision and avoiding costly mistakes.
___
Disclaimer: This content is for general informational purposes only and does not constitute investment advice, a recommendation, or an offer to engage in any investment activity. It does not take into account your investment objectives, financial situation, or individual needs. Any action you take based on this content is at your sole discretion and risk. Octa and its affiliates accept no liability for any losses or consequences resulting from reliance on this material.
Trading involves risks and may not be suitable for all investors. Use your expertise wisely and evaluate all associated risks before making an investment decision. Past performance is not a reliable indicator of future results.
Availability of products and services may vary by jurisdiction. Please ensure compliance with your local laws before accessing them.
Hashtag: #Octa
The issuer is solely responsible for the content of this announcement.
Octa
Octa is an international CFD broker that has been providing online trading services worldwide since 2011. It offers commission-free access to financial markets and various services used by clients from 180 countries who have opened more than 52 million trading accounts. To help its clients reach their investment goals, Octa offers free educational webinars, articles, and analytical tools.
The company is involved in a comprehensive network of charitable and humanitarian initiatives, including the improvement of educational infrastructure and short-notice relief projects supporting local communities.
In Southeast Asia, Octa received the 'Best Trading Platform Malaysia 2024' and the 'Most Reliable Broker Asia 2023' awards from Brands and Business Magazine and International Global Forex Awards, respectively.


