
Four GDP graphs that show how well Australia was doing – before Delta hit
- Written by: Peter Martin, Visiting Fellow, Crawford School of Public Policy, Australian National University
Australia’s economy was performing exceptionally well in the lead-up to the Delta variant lockdowns, propped up by a barrage of government spending in the three months to June and impressive household spending.
The June quarter national accounts[1] published on Wednesday show inflation-adjusted production, income and spending (gross domestic product) climbed 0.7% between March and the end of June, ahead of the NSW lockdown that began on June 26.
Were it not for a surge in imports and a weather-related decline in the volume of exports (each of which cuts measured GDP) gross domestic product would have climbed 1.7% in the June quarter.
Over the year to June economic activity grew a record 9.6%, as it climbed back from a record 7% slide in the three months to June in 2020.
Australian quarterly gross domestic product
 Chain volume measures, seasonally adjusted.
ABS[2]
Chain volume measures, seasonally adjusted.
ABS[2]
At a Parliament House press conference, Treasurer Josh Frydenberg was the first to concede the good news was historical — of “little comfort” to Australians under renewed lockdowns facing difficult days ahead.
The September quarter figures, to be released in three months’ time, were likely to show an economic collapse of at least 2% — the deepest dive since 1974, with the exception of last year’s COVID collapse.
But the starting point for the dive was better than any other developed country. Australia is the only developed country to have gone into this year’s Delta lockdowns with both GDP and employment higher than before COVID-19 struck early last year.
Read more: The four GDP graphs that show us roaring out of recession pre-lockdown[3]
Propping up gross domestic product in the June quarter was a 7.4% surge in public infrastructure spending, driven by state and local governments, which by itself accounted for more than half of the growth in quarterly GDP.
A 1.3% increase in other government spending accounted for the other half.
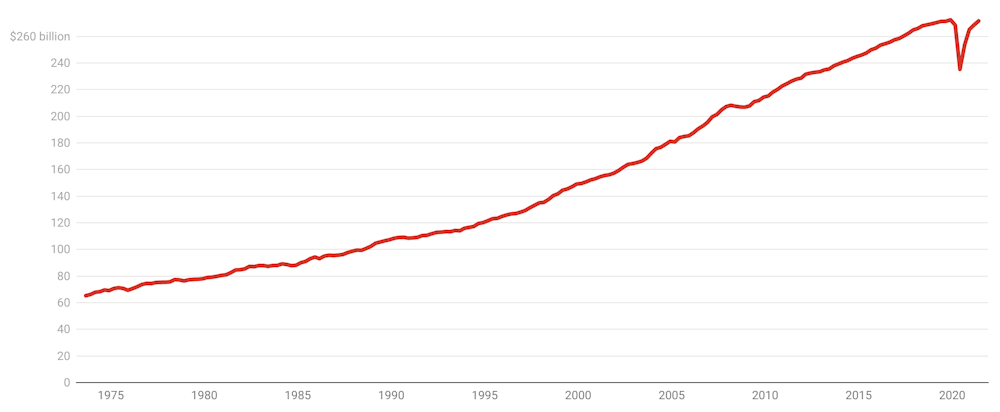
But household spending accounted for almost as much, jumping 1.1% in the quarter as Australians took advantage of a relatively COVID-free autumn to boost spending on domestic tourism, on one measure by as much as 28%.
Household final consumption expenditure
 Chain volume measures, seasonally adjusted.
ABS[4]
Chain volume measures, seasonally adjusted.
ABS[4]
Australians were in a better position to spend than the published economic growth figures suggest.
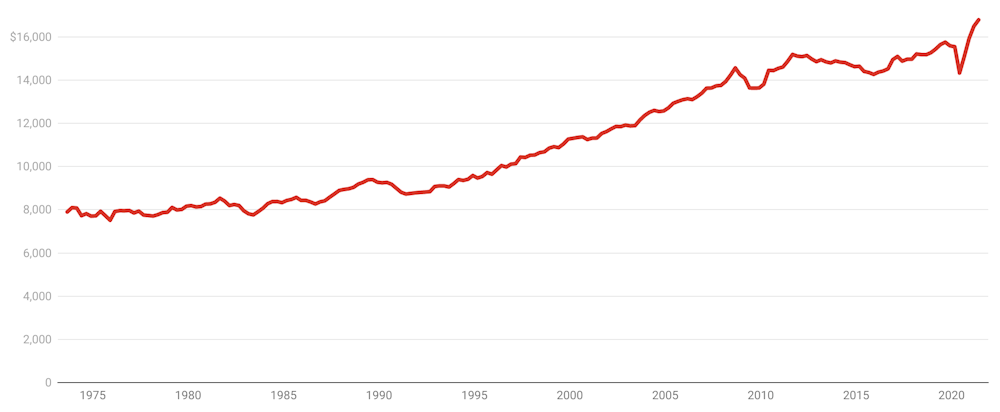
A better measure of buying power is real net national disposable income per capita. This takes account of things such as high iron ore prices, which are excluded from the GDP. It shows buying power up 1.8% in the quarter to a new all-time high.
Real net national disposable income per capita
 Chain volume measures, seasonally adjusted.
ABS[5]
Chain volume measures, seasonally adjusted.
ABS[5]
Before the Delta lockdowns, households were continuing to wind back their record high savings rate, which peaked at 22% in June 2020. They saved 9.7% of their income in the June quarter of this year, compared to 11.9% in the March quarter.
Household saving ratio
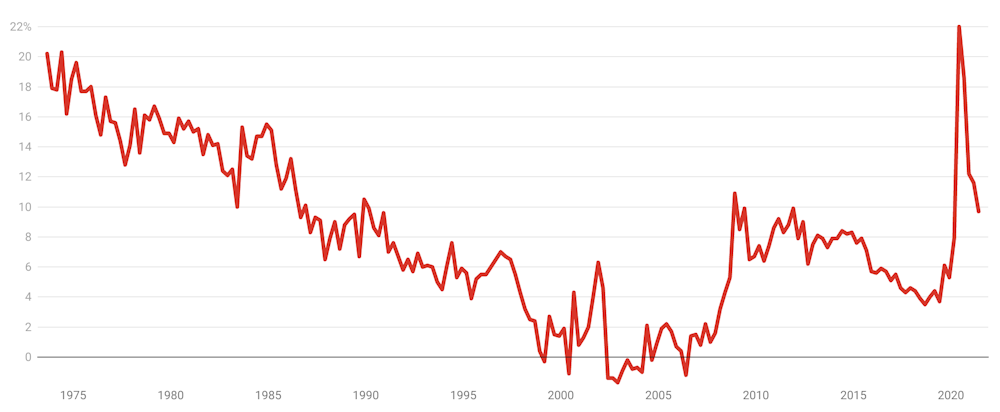 Ratio of saving to net-of-tax income, seasonally adjusted.
ABS[6]
Ratio of saving to net-of-tax income, seasonally adjusted.
ABS[6]
The lockdowns and the growing realisation they won’t have a clear end date, as they did last year, are likely to have already pushed the saving rate back up.
For months to come, today’s good economic news is set to be as good as it gets.
References
Authors: Peter Martin, Visiting Fellow, Crawford School of Public Policy, Australian National University